Boston Consulting matrix
Contact us for assignment help at ozhelpassignment@gmail.comIntroduction
The Boston Consultancy Group (BCG) matrix classifies product lines into four categories based on market share and market share growth rates. The BCG growth matrix helps firms to decide how much money to invest in a product line, based on whether a product has a good market share and whether the market share is increasing, decreasing or remaining constant.
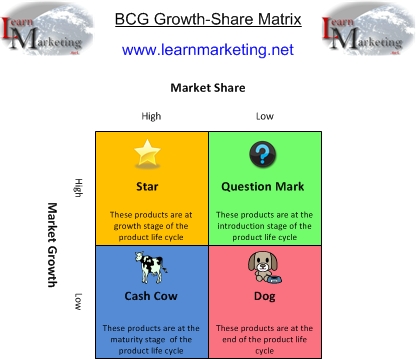
Star (High Relative Market Share, High Growth)
A product classified as a star has a high market shares in a market that is growing. A star is at the growth stage of the product life cycle so it will need investment (money) to maintain its growth rate and market leading position. It is also generating money for the company so it is worth the investment. The challenge for the business is to turn it into a cash cow.
Cash Cow
Cash Cows are products at the mature stage of the lifecycle, they generate high amounts of cash for the company, but their growth rate is slowing. As market growth rate is slowing, investment should be reduced to maintain current market share. There is a chance product sales may start to decline, appropriate marketing mix strategies should be employed to try to prevent this from happening. The firm could also look at reducing costs through price leadership strategies. A cash cow is at the maturity stage of the product life cycle.
Dogs
These are products which have low market shares and low market growth rates. A dog will generate low profits or even a loss. Therefore dogs drain business money, time and resources. If the dog is not providing the company with any benefit e.g. gateway to other product sales it is probably best to phase it out. Some businesses may decide to re-invent the dog and injecting new life into the product. (see Heinz Case Study). A dog product is at the end of the product life cycle.
Question Mark/Problem Child
These are products with a low market share but operate in high market growth rates. The challenge for the business is to discover what is causing the low market share and hindering growth. The danger is that the business invests a lot of money in the product without an impact on growth rates. However if the business can solve the problem a question mark product can generate good returns.
The BCG matrix is a good starting point when reviewing an existing product line to decide future strategy and budgets. The market share is compared (relative to) against the largest competitor in the industry. The BCG helps firms analyse future opportunities or problems with their product lines.
http://ozassignment.blogspot.in/2015/03/porters-five-forces-model.html
Contact us for assignment help at ozhelpassignment@gmail.com
What a great post! This blog is filled with a lot of neat ideas
ReplyDeleteCustom Law Essay